Thursday, September 29, 2022

Activity 3.2.1- Natural Resources Review


The concept map above is a general topic overview of Exploring Natural Resources. We start off this map in the very center with the given foundation of what natural resources are, and why they are important to us. Natural resources are easily defined all around us, and as stated in the map, we need them to survive. These are the resources that are found within our environment and are developed without the intervention of humans. The broadest categories of natural resources might include nature, food, and energy sources, which I have also provided examples of as the topics expand. The most crucial part of understanding natural resources is by viewing them as either renewable, meaning that they can be replaced by nature, or nonrenewable, in which they cannot be replaced.

There are also some very important factors to consider when thinking of our natural resources and how we can preserve them. This is where sustainability, recycling, and reusing comes into consideration. Though some of these resources cannot be used up, they can most definitely become scarce if we don't use them wisely. That's why participating in these practices are important not only the production of our resources, but in the longevity of them as well.


Video Source:

Jerome, B. A. (Producer). (2017). Exploring Natural Resources [Video file]. Visual Learning Systems. https://nvcproxy.alamo.edu/login?url=https://video-alexanderstreet-com.nvcproxy.alamo.edu/p/oZvY48GoBLinks to an external site. 

Thursday, September 22, 2022

Activity 3.1- Human Population

 Caribbean


Haiti

  • Birth rate: 23 per 1,000 population
  • Death rate: 8 per 1,000 population
  • Population growth rate: 1.5
  • Percent of population <15: 32
  • Percent of population 65+: 5
  • Life expectancy: 62 male, 67 female
  • Fertility rate: 5.4 in 1990, 2.8 in 2020
  • Gross National Income (GNI): $2,930

Puerto Rico

  • Birth rate: 6 per 1,000 population
  • Death rate: 9 per 1,000 population
  • Population growth rate: -0.3
  • Percent of population <15: 16
  • Percent of population 65+: 21
  • Life expectancy: 77 male, 84 female
  • Fertility rate: 2.2 in 1990, 1.0 in 2020 
  • Gross National Income (GNI): $24,010


Haiti takes the place of having the least developed, or "less industrialized" country average for births per 1,000 population, while Puerto Rico, on the other hand, was the most developed. You can see some particularly drastic differences in the averages between the two countries. These statistics fall into the category known as demographics. As explained in the U.S Census Bureau, "Demography applies the principles of population ecology to the human population.  Demographers study how human populations grow, shrink, and change in terms of age and gender compositions using vital statistics about people such as births, deaths, population size, and where people live (2.6 demographics)." We can also acknowledge that though these numbers might differ, the death rates are not too far off. As far as life expectancy goes, many countries have a female majority as a result of the longer life expectancy for females. This could apply to both Haiti and Puerto Rico. The life expectancy of the population within Puerto Rico actually surpasses Haiti, with the majority of females living to the age of 84, and males living to the age of 77. Meanwhile Haiti's numbers stay within the average 60's. For both countries, there are also noticeable drops in their fertility rates from the year 1990 to the more recent 2020. It seems Puerto Ricos rate was already pretty low to begin with, but it still dropped to a 1.0. Which is why they have the lower birth rate in comparison to Haiti. This is why it is so important to recognize the way in which these demographics fall back on one another in co-existence. The lower the numbers are for the country's birth rate, the higher their gross national income will be. Otherwise known as the GNI, this number is measured per capita, and serves as a way to look at the country’s income divided by its population and is the easiest way to compare income per person in a country. GNI per capita can also be considered as a strong indicator of the standard of living that the average person might have in that area. Puerto Rico for example, has a birth rate of 6, which makes their GNI at a whopping $24,010. Whereas Haiti's higher birth rate of 23, caused them to suffer from a GNI of $2,930.
Let's now discuss the difference these two countries are in comparison to the whole world's average demographics shown on the table. Though Puerto Rico was the most developed between the two countries, their numbers weren't strong enough to lead with the worlds expected average of a $47,551 GNI. This would be the biggest difference in all categories without a doubt. Puerto Rico also fell within the expected rate of natural increase, being at -0.3, while the world shows a -0.2. Haiti's GNI fell short as well, but nothing too dramatically unexpected, which goes for the following categories as well, the numbers all fell within the same scale.


References:

Population Reference Bureau. (2021). 2021 world population data sheet.

U.S. Census Bureau. (2018). International database. International Programs. https://www.census.gov/data-tools/demo/idb/informationGateway.php


Tuesday, September 20, 2022

Activity 2.3- Biosphere and Interconnections

Concept Map 1

Concept 2


Concept Map 3


Concept Map 1:
The key ideas discussed within chapter four consists of energy transformation, energy flow, and a brief mention of the units of energy. When viewing the graph, it is important to follow the guidelines and recognize the colors in which the topics and explanations are given. For example, the energy transformation topic (dark blue), discuss' the Laws of Thermodynamics (dark green), and those laws are defined to the side (light green). Then, we have the topic of energy flow, which, too, includes the Laws of Thermodynamics, therefore there is another line drawn towards it. In terms of an ecosystems source of energy, this is tied to solar radiation in its own topic. However, solar radiation is also how autotrophs gain their energy. So, in other words, each category consists of subcategories, and so on and so forth. The flow of energy, when speaking of organisms, will consist of the autotrophs and heterotrophs in an environment. It is important to note that autotrophs are primary producers, while heterotrophs are primary consumers. The map proceeds to aid for the discussion about the food chain/web. Altogether, the chapter focuses on the flow and exchange of energy in terms of how it occurs between organisms and the environment, including the sun and the importance of its solar energy.


Concept Map 2:
For chapter 7, the map gets a little more complex. It starts by addressing the values of biodiversity: utilitarian and intrinsic. We then have the topic of the organization of life, which are separated into kingdoms. I felt it was important to categorize these kingdoms into the prokaryotes and eukaryotes. For the prokaryotic kingdoms, we have monera and animalia. The eukaryotes are fungi, plantae, and protistas. Each kingdom is given a brief description as well. I decided to include a more in-depth description for both the fungi and plantae categories because of its mention on the text. For fungi, I included a list of the three main divisions; ascomycetes, basidiomycetes, and zygomycetes, in addition to what they are. For plantae, I included two plant categories while listing the specific examples of them underneath (light yellow).


Concept Map 3:

Chapter 8, and short and sweet map discussing biomes. I started with the pure definition and description of a biome, and on the left, I explain what exactly distributed biomes into their own categories. We have terrestrial, freshwater, and marine biomes. Within the freshwater biome category, there are two branches discussing the difference between the lentic and lotic ecosystems and what puts them under that topic. As a sidenote, I added the branch of ecoregions and ecozones, practically biomes on a bigger scale before they were classified as such.


Text reference

Freedman, B. (2018). Environmental science: A Canadian perspective. Halifax, Canada: Dalhousie University Libraries.


Thursday, September 15, 2022

Activity 2.2.1- My Water Use

An average of three water bills:

2,244+2,992+2,244= 7,480 gallons/month on average


Per person per month use:

7,480/3 (people)= 831 


Per person per day amount of water use (on average):

831/30 (days)= 27.7 or (rounded to) 28 


Home Water Works Calculator

https://home-water-works.org/calculator

Calculated per day use= 53 gallons


Water Management District

https://www.swfwmd.state.fl.us/conservation/water-use-calculator

Estimated calculated household water use= 159

159/3= 43 gallons per person per day


Water use explained:

There is no doubt that these results are better than someone's, and maybe even worse than another's. When answering the questions to give the calculator a better estimate, I realized that we do not have a lot of utilities that other households might that really require more water usage. For one, we don't have a pool, so that eliminates the water use it takes to constantly be draining and refilling when needed, not to mention the upkeep/maintenance it might require during the week or month. Another factor that contributes to our lower numbers is the fact that we don't have a dishwasher. Those with a dishwasher usually rinse it in the sink first, and proceed to turn the washer on as it continues to run for a while. I will also shamelessly admit, we don't use the water hose often, or at all for that matter because of our already dead grass that is beyond saving at this point. We never water the grass, but we do, however, have a cluster of plants in the backyard that we may water a few times throughout the week (if my grandma remembers). Therefore, our main water usage lies within the showers and bathroom visits throughout the day and week. 

Compared to the average estimate given for a household of three, the average water usage should roughly be around 46 gallons. The results weren't as far off as I thought, at least from each other, since they were only distinguished by a 10-gallon difference. Although both calculators gave an answer that was right within the standard ballpark, our average was still lower. Which definitely isn't a bad thing, and it makes sense once I address the difference in utilities our house may have in comparison to others. But then again, some might even tend to work harder to preserve more than we unconsciously do.


Tuesday, September 13, 2022

Activity 2.2 Cryosphere: Grinnell Glacier


The first original black and white image is of the Grinnell Glacier taken in the year 1938.
(T. J. Hileman, GNP Archives, 1938)
The second was taken of the Glacier in the year 2016.
(Dan Fagre, USGS, 2016)
Lastly, we have a web capture of the Glacier taken from a Google Maps satellite view from 2019.
(Google Maps, 2019)


Problem
The issue that comes with glaciers lies within its correlation to the weather and our ever-evolving environment. These problems could go as deep as discussing the involvement of climate change and global warming. But beliefs aside, there is no denying the visual changes happening to our hydrosphere and cryosphere. As discussed in module 2.2, glaciers can reflect sunlight, which make it hard to preserve its frozen state for as long as possible. Glacial ice also affects the global heat transport. Between the various seasons of droughts, rain, and snowfall, there's no doubt that the Glacial preservation would be at jeopardy. Glaciers are actually a huge indicator of climate change because their physical changes, whether they are growing or shrinking, advancing or receding, they provide visible evidence of changes in temperature and precipitation. If glaciers lose more ice than they can collect through new snowfall, they eventually proceed to add more water to the oceans, leading to a rise in the sea level. And between the various seasons of annual droughts, rain, and snowfall, there's no doubt that the Glacial preservation would be at jeopardy. 


Explanation
Due to its high altitude and narrow standpoint, the Grinnell Glacier is considered as an Alpine Glacier. Which, of course, mean that it will move a few centimeters each day. They usually grow up top while it's easier to melt and break off at its lower elevations. Coming from the National Park Service website, "Grinnell Glacier lost 113 acres between 1966 and 2015. The Howe Ridge fire burned thousands of acres in a few hours on August 12, 2018. Glacier National Park is warming at nearly two times the global average and the impacts are already being felt by park visitors. (NPS, May 19, 2022)" When observing the photos above, there is a noticeable growth in the body of water surrounding the Grinnell Glacier. More of the rock underneath the ice is exposed in comparison to the original photo. However, I will say, comparing the 2016 and 2019 photo, the difference isn't as drastic. So, although the sun makes it inevitable to experience such changes, the Grinnell might not have it as bad as the others. 


References

“Climate Change.” National Parks Service, U.S. Department of the               Interior, https://home.nps.gov/glac/learn/nature/climate-change

EPA, Environmental Protection Agency, https://www.epa.gov/climate-indicators/snow-ice.

“Glacier Repeat Photos.” National Parks Service, U.S. Department of the Interior, https://www.nps.gov/glac/learn/nature/glacier-repeat-photos.htm.

Google Maps. (2019). Grinnell Glacier, Montana. Retrieved from https://goo.gl/maps/mAR2cfsrY4s6LaMQA

“Glacier Repeat Photos.” National Parks Service, U.S. Department of the Interior, https://www.nps.gov/glac/learn/nature/glacier-repeat-photos.htm.

T. J. Hileman, GNP Archives, (1938), Dan Fagre, USGS, (2016) Left and right aerial view of the Grinnell Glacier.


Thursday, September 8, 2022

Activity 2.1 – Atmosphere: Tracking My Greenhouse Emissions


  • Problem
Total greenhouse gas emissions are the sum of emissions of various gases: carbon dioxide, methane, nitrous oxide, and smaller trace gases such as hydrofluorocarbons (HFCs) and sulfur hexafluoride (SF6). According to the EPA, Environmental Protection Agency. With constant global warming issues, this investigation looks into the amount of greenhouse gasses that are released on a daily/weekly basis through my normal life routines, the results are as follows:


  • Investigation
Methane Emission over four days
Fossil fuel: Driving to and from work, putting gas in my car.
Livestock/ Agriculture: The cows and horses we have on my family's ranch (released through enteric fermentation).
Waste: The trash collected throughout the week, the wastewater running from the sink from washing dishes, and the bath faucet as we shower.


Carbon Dioxide Emission over four days
Electrical: The AC went out on Monday, and we got an electrical portable unit for my room, but we have to be cautious of when and how long we leave it on for, because of the electricity it takes up. 
Using the microwave and the stove to warm up and cook food throughout the week. 
Biological materials: The trees and plants around the perimeter of our house.


  • Data Analysis and Interpretation using mathematical and computational thinking.
According to the EPA, "in 2020, the electric power sector was the second largest source of U.S. greenhouse gas emissions, accounting for 25% of the U.S. total." This was the most helpful source in terms of percentages and overall data to compare to. So, I can easily say that my electrical emission has to take the lead by an estimated 50% in comparison to the other outlets. Therefore, it is my first largest source. With that being said, my second source would have to be from transportation, roughly guessing it to be at 30% throughout the week.
This leaves my residential and commercial at 15%, and agricultural at 5%. In means of transportation, I drive 2 miles to and from work, so it isn't as bad as working across town since it is super close down the street, but I sometimes get stuck on the worst street of traffic and travel larger distances when going to a friend or family's house or when running errands. I drive a 2012 Kia Soul, which has 27 MPG, 25 in the city, and 30 on the highway and 3.7 gal/100km. The Kia soul average fuel consumption is 49.1 MPG or 5.8 liters/100km and average CO2 output is 143.0 g/km based on 98 models. So, using my car, I need 9.28 liters, or 2.5 gallons for the two miles that I drive to work. Multiply that by the 4-5 days a week that I work, which leads me to using roughly 45-46 liters, (19.6x the 2.5 gallons) which means that my car emits 49 gallons a week.


  • Develop an argument from evidence.
The emission of particular greenhouse gasses might be inevitable to contribute to, but not completely impossible to reduce. We have to be smarter and more considerately cautious about what we use and if it is really necessary. If so, it is important to work harder on ways to work around such extreme harmful emissions, for us and the future of our environment.


  • Explanations and Designing Solutions

The emission through transportation would be because of my car that I drive to work pretty much every day, and if I am not in my car, I am with my mom in her minivan. Studies happen to show that "the largest sources of transportation-related greenhouse gas emissions include passenger cars, medium- and heavy-duty trucks, and light-duty trucks, including sport utility vehicles, pickup trucks, and minivans. These sources account for over half of the emissions from the transportation sector." Therefore, some possible solutions to this issue would include the use of electricity from renewable sources, such as wind and solar; or fossil fuels that are less CO2-intensive than the fuels that they replace. Which means using electric or hybrid automobiles, where the energy is generated from lower-carbon or non-fossil fuels. In addition, reducing travel time and driving more sensibly when accelerating could also help contribute the decrease in emission. Then, of course, it would be better to walk or bike to certain places that are in closer proximity instead of having to drive the unnecessary distance.

In regard to the electrical usage, there are many factors that are simply wants and not needs that could help reduce a lot of the gas emission. Having multiple fans plugged in, bluetooth speakers, hairdryers and straighteners, etc. I could definitely work on being more mindful of those things. One that I need to get better at is not continuing to leave my phone charger in for long periods of time after I am done using it. Some universal solutions include converting a coal-fired boiler to use of natural gas, or co-firing natural gas and shifting dispatch of electric generators to lower-emitting units or power plants. It would be way more helpful if we continued by using renewable energy sources rather than fossil fuel to generate electricity.


Cited Sources:

“Compare Side-by-Side.” Www.fueleconomy.gov - the Official Government Source for Fuel Economy Information, https://www.fueleconomy.gov/feg/Find.do?action=sbs&id=31823.

EPA, Environmental Protection Agency, https://www.epa.gov/ghgemissions/overview-greenhouse-gases#methane.

EPA, Environmental Protection Agency, https://www.epa.gov/ghgemissions/sources-greenhouse-gas-emissions.

“Microwaves Might Emit as Much Greenhouse Gases as Cars: Study.” The Indian Express, 18 Jan. 2018, https://indianexpress.com/article/technology/science/microwaves-might-emit-as-much-greenhouse-gases-as-cars-study-5030422/.

Ritchie, Hannah, et al. “Greenhouse Gas Emissions.” Our World in Data, 11 May 2020, https://ourworldindata.org/greenhouse-gas-emissions.


Tuesday, September 6, 2022

Module 1.2 - A Turning Point Event for Environmental Science, Silent Spring

 Point of View

This specific PBS special is told to its viewers in a third-person perspective. The media is created almost as a critical biography of the famous author known as Rachel Carson. We get an insight into the time period in which Rachel lived and what exactly made her famous, which was, of course, the publication of "Silent Spring." We get also get a third-person insight behind the hot research topic of that time, DDT.


Purpose

The sole purpose of this video is to discuss the importance of Carsons' writing and explain how it was such a huge warning to the public that not everyone seemed to be aware of. She spoke on environmental issues and their relation to mankind, which sparked a lot of controversy to begin with. The video puts you into this time period so that you can learn what was going on at the time and why Carson caught so much attention with her book. We are given background information on Carson and what led her to the moment of publication as well as what made her such a credible source to be reckoned with.  Furthermore, Carsons purpose was to educate the public on these issues and give her own theories on the evolution of our environment, the readers seemed to have done to rest of the work from there themselves. In addition, the video also educated viewers on the 'new generation insecticide' DDT. It was explained how DDT became a common solution to insect-borne diseases and how the public ran with that information as well. 


Questions at Issue

During this time, the Cold War was at its peak. Which also meant that our safety and environmental status was constantly being tried and questioned. The main problem stood within our environment being constantly contaminated. Why was it happening? Who is at fault for these issues? How will it affect our safety? Is DDT safe for everyone? Should we be using it? Therefore, Rachel Carson offered answers to these questions when Silent Spring was published. However, the public took this book in many ways. Some began to view her as a 'communist' because of her viewpoint(s) and accusations, while others found her as a legend that brought a light and possible solutions to our problems. "To some, it was an act of heroism, to others, an irresponsible breach of scientific objectivity." 


Information, data facts and observations

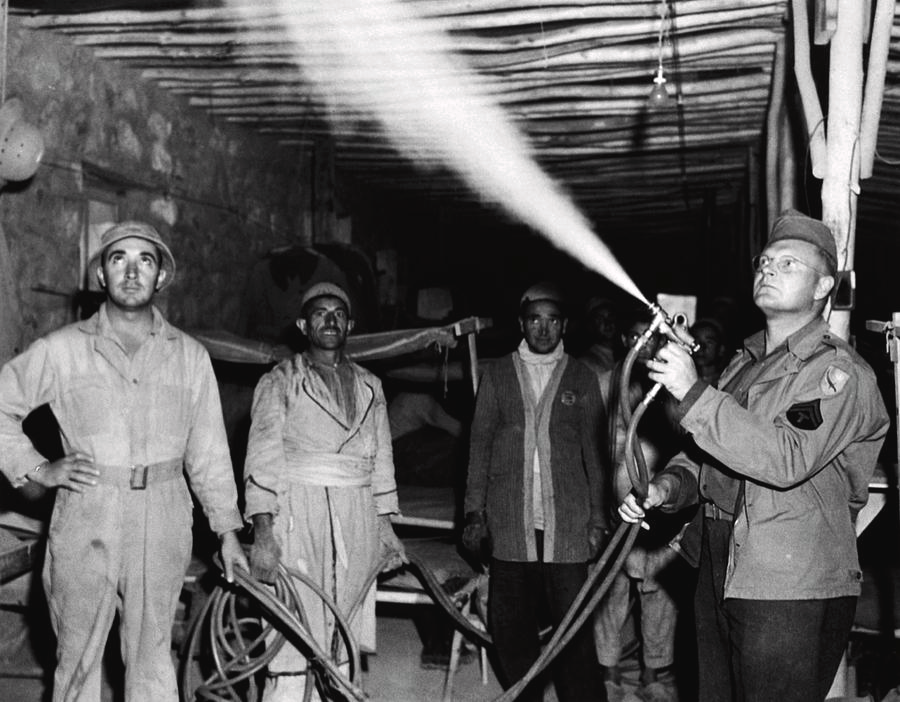
Written in 1962, Rachel Carson put out one of the best-selling books of that time, "Silent Spring", and remained in the public eye ever since. Carson was 38 when she wrote the book and furthered her research. Not only was she a writer, but she was training to be a biologist. Prior to her public popularity, she worked for the U.S Fish and Wildlife Service overseeing incoming publications while residing in Maryland. Then, Carson caught word of an experimental examination happening locally that she developed a major interest in. At the Patuxent Research Refuge, scientists were examining the environmental impacts of a new chemistry-lab creation called DDT, abbreviation for the synthetic pesticide: dichlorodiphenyltrichloroethane. Apparently after being derived from the 19th century, it wasn't until 1939 that scientist Paul Muller discovered that it could be useful as an insecticide. Thus, after the bombing of Pearl Habor, the military used DDT in the battle zones in effort to protect troops from insect-borne diseases. After word about it not being harmful to humans, DDT powder spraying stations became popular in order to prevent typhus from spreading and occurring. However, Carson saw that this insecticide "caused collateral damage to the wildlife". That's when she questioned the legitimacy of the use of DDT and continued to warn the public on being aware and cautious of how they continued to use it.


Interpretation and Inference

Before all eyes were on Carson, chemists and biologists believed that man is the one that controls nature on its own. Where, unlike the other scientists, as claimed in the source, Carson believed that "the balance of nature was/is a major force in the survival of man." She changed this perspective and started this massive amount of attention to be spotlighted on her viewpoint and what she claimed in her book. The interpretations in the video happen mainly around Carsons book and the way the public took in a lot of the new environmental information that was being introduced at that time, (such as DDT). 


Concepts

Of course, the main concept being discussed is around the environmental contamination and status that was active during and around the time of the cold war. Environmental contamination, defined by law, is the inclusion of hazardous materials at such levels, quantities or location, or of such form or character, as to constitute a violation of Requirements of Law. The main element being discussed was DDT and the most popular disease during the time of war being typhus. Typhus is group of infectious diseases caused by bacteria which spread to humans through fleas, lice and chigger bites.


Assumptions

Some assumptions made in the video could stem from multiple details. One being about the audience Carson had as a result from her book. Unless you research reviews and commentary from specific individuals, it is hard to tell whether she has more criticizers or supporters. Another assumption might be on Carson and her agenda behind writing "Silent Spring". The video claimed that she was the one who wanted to be in the public eye, which might be true, but it also might be for different reasons. Depicted on the different tones and comments within the video, this was stated as if Carson dug herself a hole to be harshly viewed and criticized, but later on, it is said that she just desired a wider audience to be heard, a reason we could only confirm from Carson herself. Then there are a few holes within the DDT situation and why the public automatically agreed to use it as prevention of insect-borne diseases. 

Consequences

A main consequence could be the effect of DDT and its use by the public. Because it was used once successfully, the public ran with that and abused its use by creating "spray showers" to try and prevent diseases. Understandably, at the time, they were desperate for safety and preventional possibilities, but because of the over usage, our wildlife and environment suffered. There were still so many unsolved questions and safety studies around DDT that weren't performed before using it to such an extreme, and it showed.


5.

 https://th.bing.com/th/id/OIP.jjd_T9e0_JaWbryLJfI4dgHaCz?w=285&h=132&c=7&r=0&o=5&dpr=1.5&pid=1.7


video cited:

https://www.youtube.com/watch?v=SeJNRaE11A0